Scan any repository directly from the Tomosu AI web app — no extension required. Connect your repo, run a reliability analysis, and get a full Production Risk Index (PRI) score with prioritised recommendations, all in the browser.
The Tomosu AI web app lets you scan any repository without installing an extension or setting up a CI integration. Sign in, paste your repository URL, and Tomosu runs a full reliability analysis across eight production-readiness dimensions, returning a PRI score from 0 to 100.
Go to tomosu.ai/start and enter your work email address.
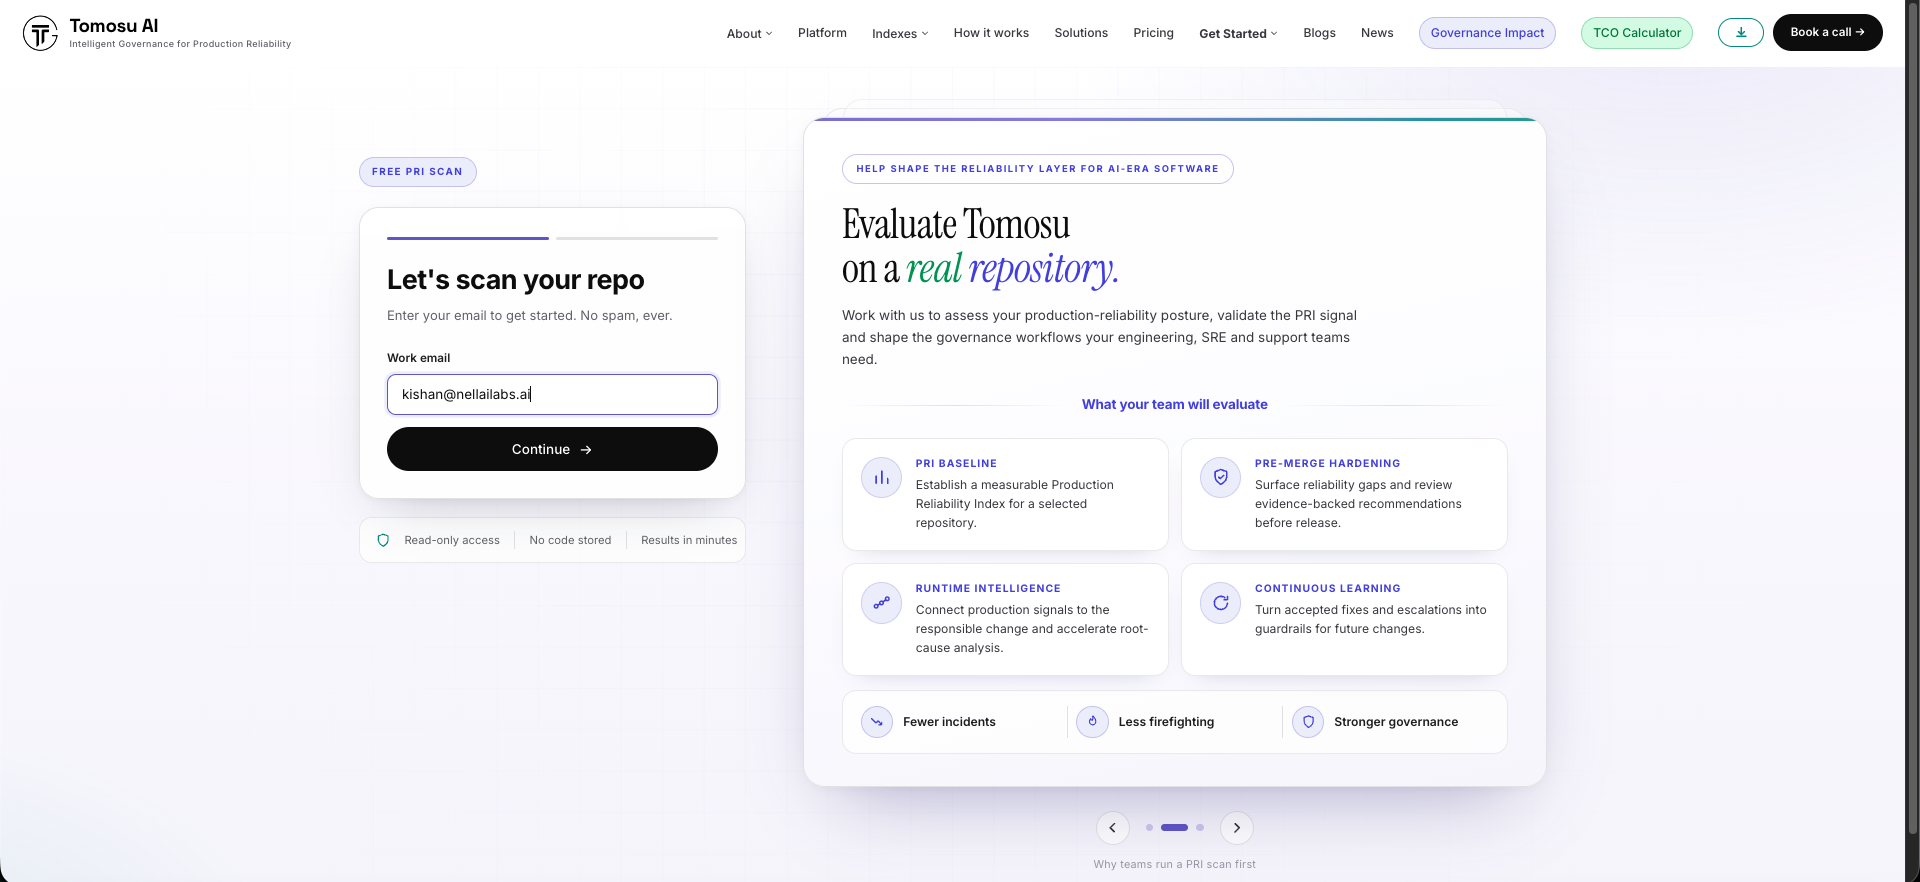
Click Add Repository (or New Scan) and enter your repository URL. For private repositories, you will be prompted to authorise Tomosu via GitHub OAuth so the scanner can read your code. Public repositories can be scanned without any OAuth step.
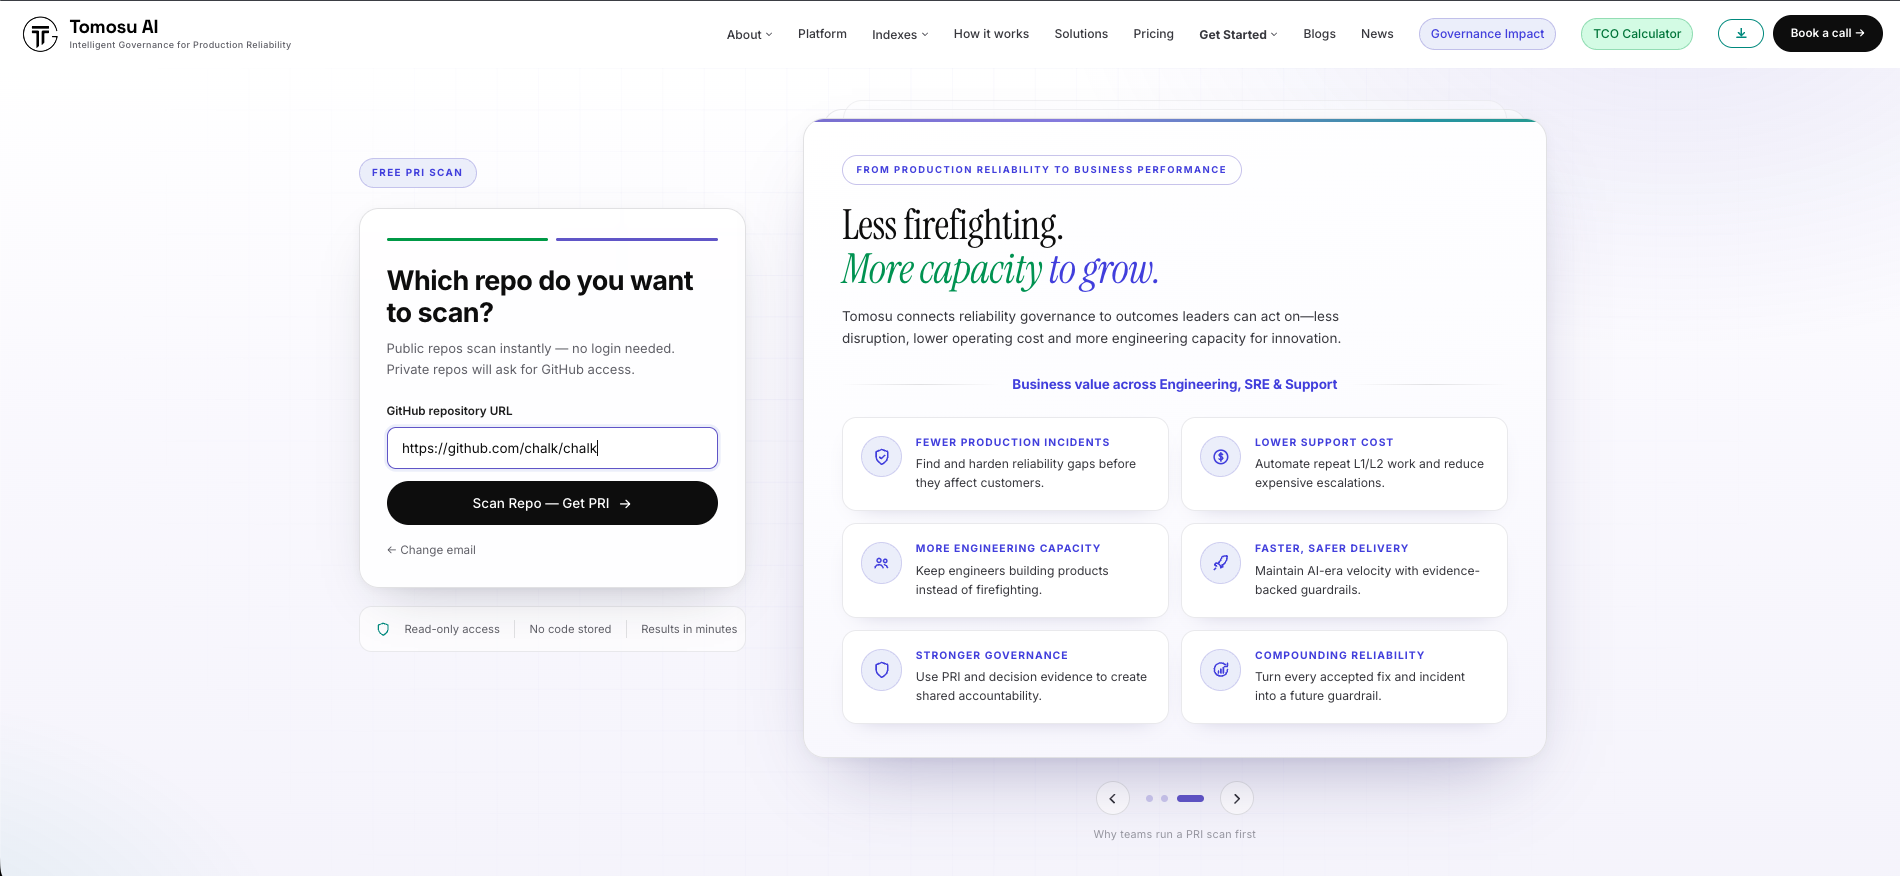
After Tomosu detects the repository, you will see a summary of the project structure, primary language, and detected package files. Confirm the details are correct, then click Start Scan to begin the reliability analysis.
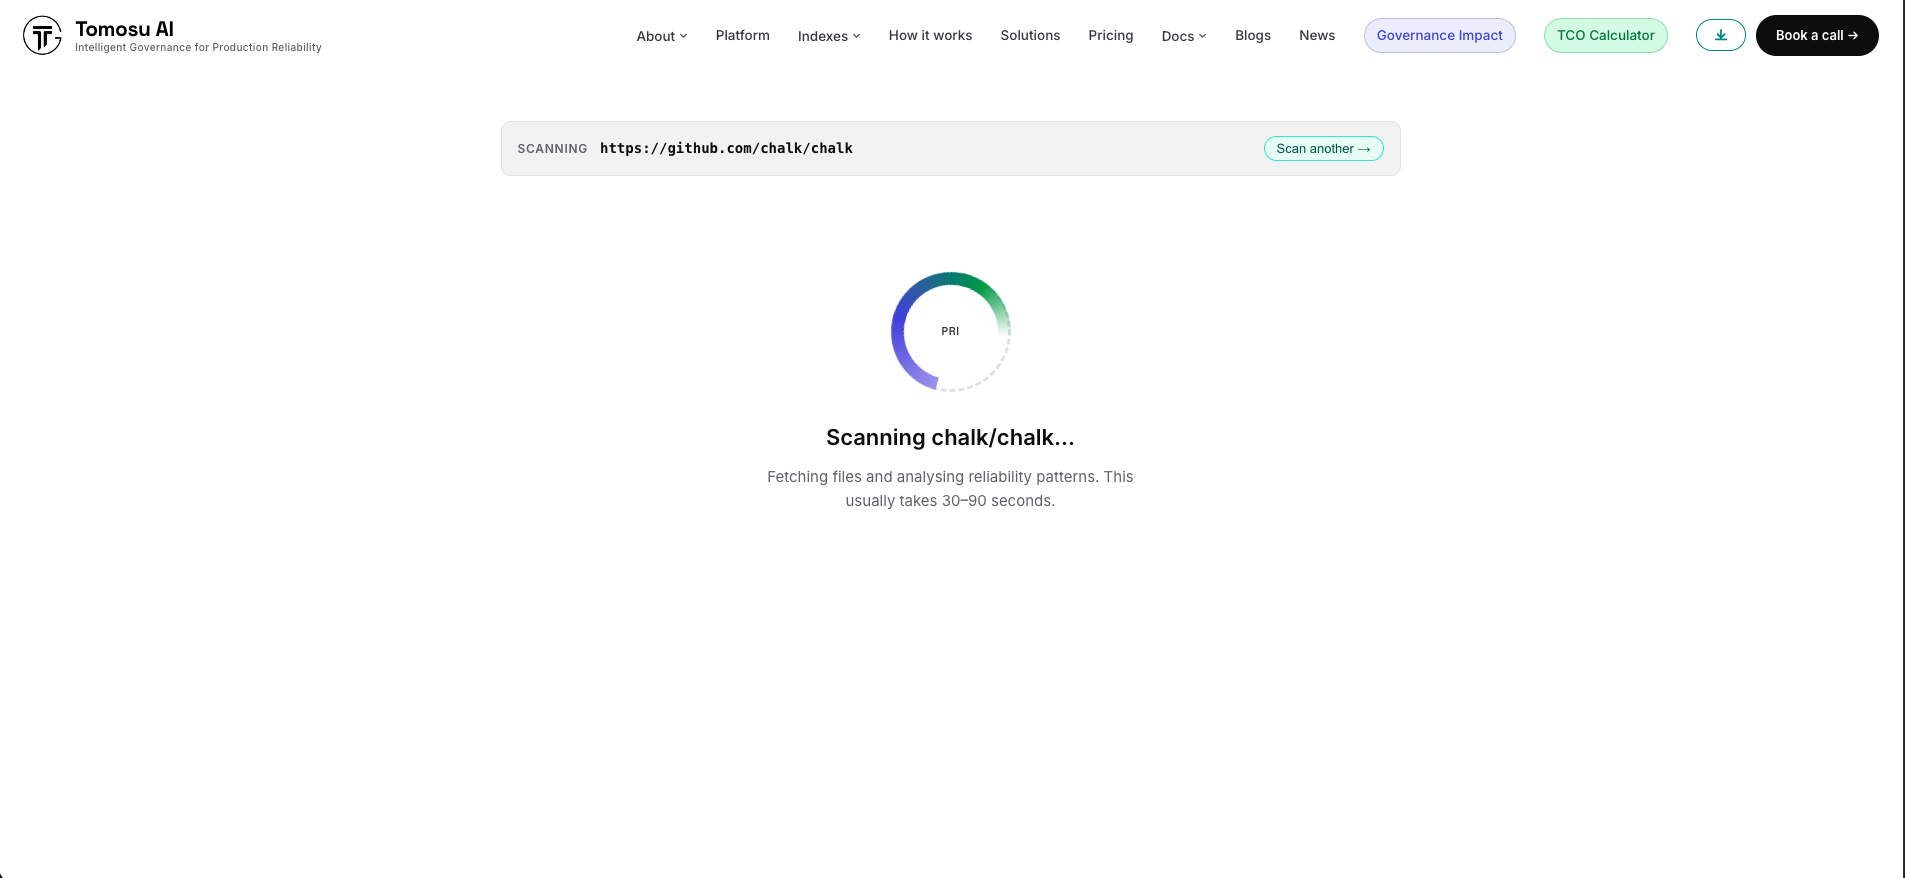
A scan analyses your repository against eight reliability dimensions and produces a Production Risk Index (PRI) score. The analysis is read-only — it never modifies your files or creates commits.
The scan progress screen shows which reliability dimensions are being evaluated in real time — Fragility Index, Governance Compliance, Code Volatility, and more. A typical scan on a mid-size repository completes in under three minutes. You can leave the page and return; the scan continues in the background and you will receive an email when it finishes.
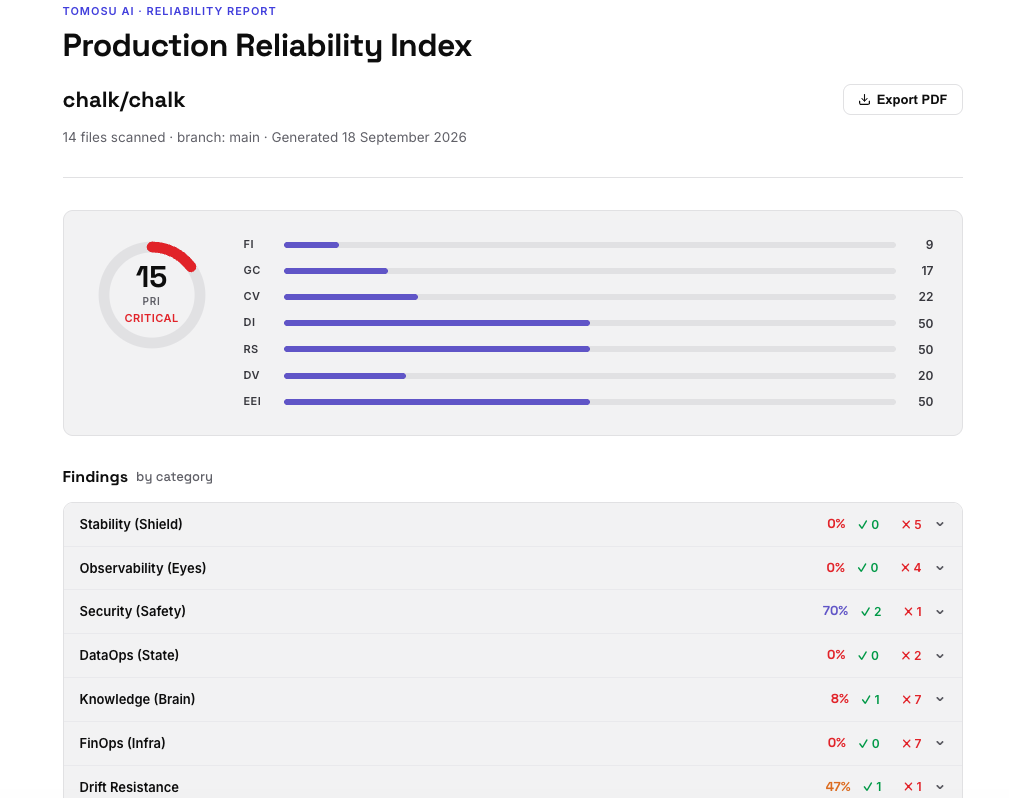
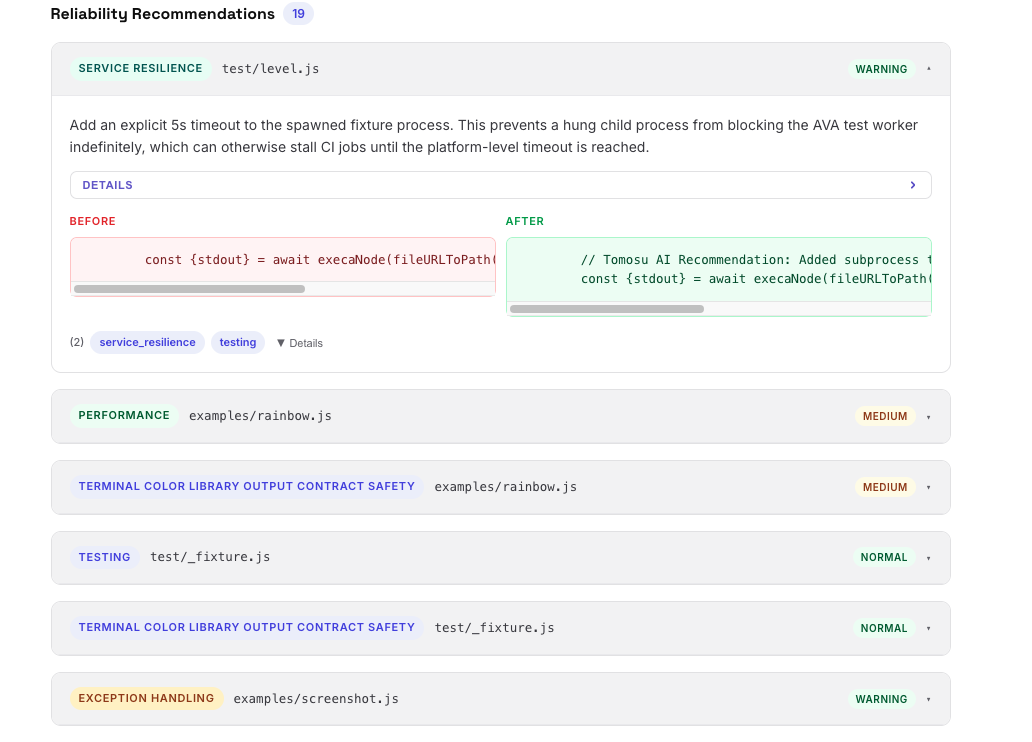
When the scan completes, you land on the results page. The top of the page shows your overall PRI score and a breakdown of all active sub-indexes. Below that, all recommendations are listed, grouped by category and ordered by production impact.
The results panel shows your overall PRI score out of 100, colour-coded by risk level (green ≥ 70, amber 40–69, red < 40), followed by individual scores for each active index. Indexes that could not be scored (e.g. Runtime Signals without a connected log agent) are shown as “No data” with a link to connect the relevant integration.